Notebooks as Posts: An R Demo
seedling
Same pipeline, different kernel: this one runs through R's knitr engine

Quarto doesn’t care which language produced
the numbers — the same .qmd → Hugo pipeline used in the
Python demo
works for R too, executed
through knitr instead of Jupyter. (Quarto 2026)
(Xie 2015)
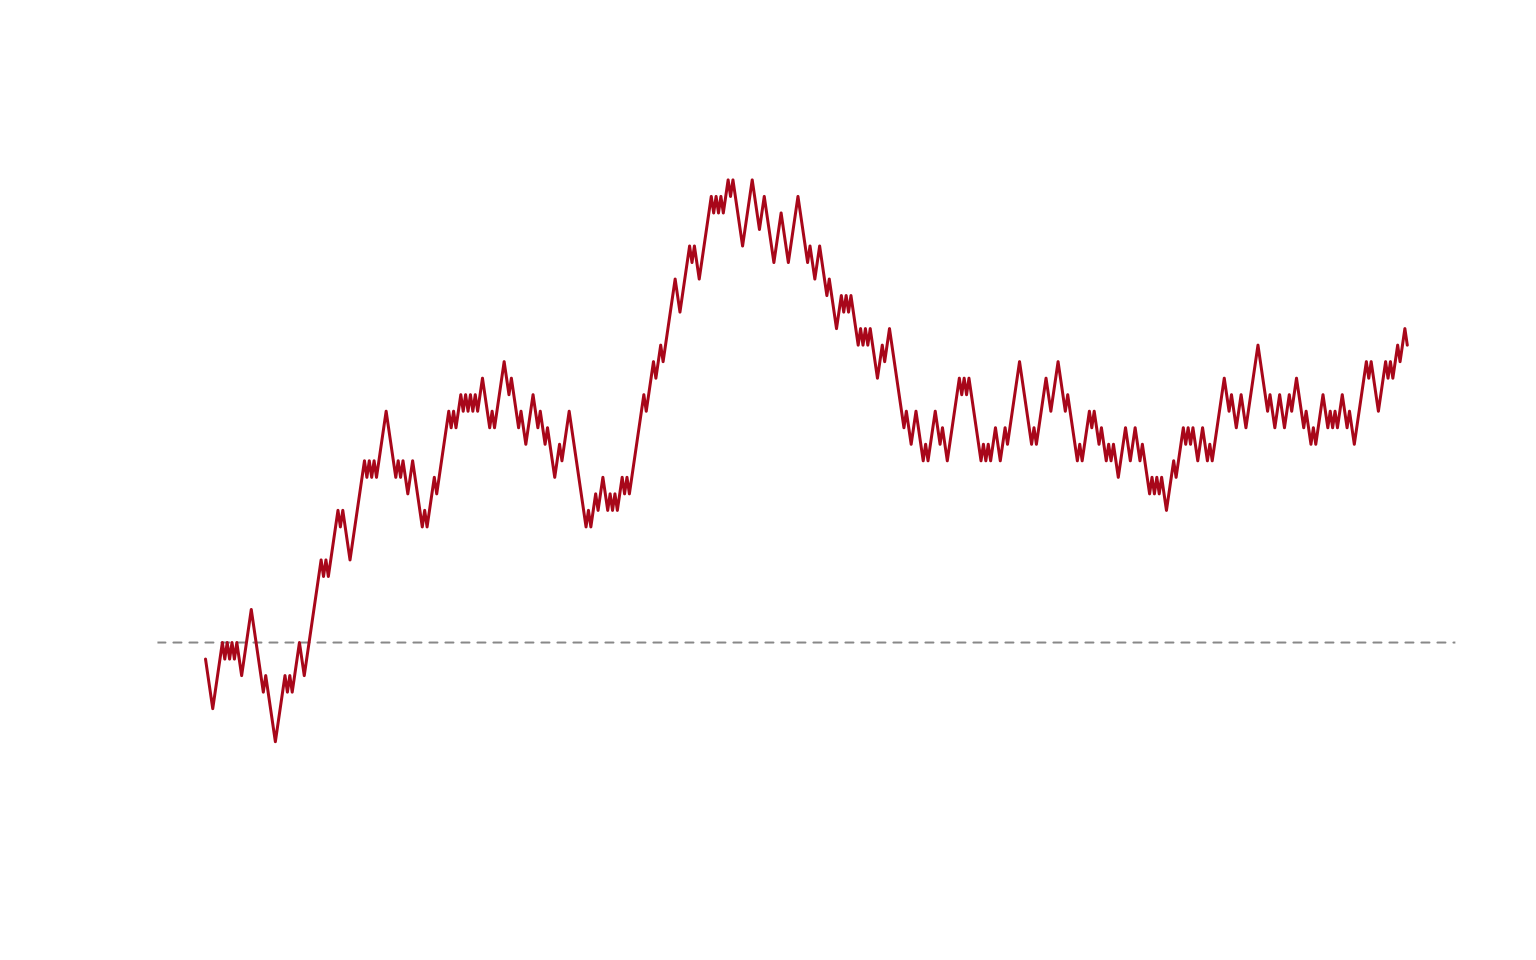
A simple random walk, simulated and summarized:
set.seed(42)
steps <- sample(c(-1, 1), 500, replace = TRUE)
walk <- cumsum(steps)
summary(walk)
   Min. 1st Qu.  Median    Mean 3rd Qu.    Max.
  -6.00   11.00   13.00   13.18   16.00   28.00
plot(walk, type = "l", col = "#a8071a", lwd = 1.5,
     axes = FALSE, xlab = "", ylab = "",
     panel.first = abline(h = 0, col = "#888", lty = 2))
Data frames render as ordinary tables, the same way they would in any other Quarto document:
knitr::kable(head(data.frame(step = seq_along(walk), position = walk), 5))
| step | position |
|---|---|
| 1 | -1 |
| 2 | -2 |
| 3 | -3 |
| 4 | -4 |
| 5 | -3 |
The point, same as the Python post: this table and plot are computed by R at build time, not maintained by hand.
References
- Posit, PBC (2026). Quarto Documentation. Quarto.
- Yihui Xie (2015). Dynamic Documents with R and knitr. Chapman and Hall/CRC.